返回

基本波形二氧化碳图作为机械通气过程中的持续监测工具

文章

作者: Joe Hylton,MA,BSRT,RRT-ACCS/NPS,NRP,FAARC,FCCM,临床应用专家,Hamilton Medical Inc.

日期: 15.07.2021

波形二氧化碳图对重症监护医学并不陌生。它是一种广泛使用的气道管理验证工具,广泛用于清醒镇静环境,以及需要机械通气的插管病人的机构间转运。 波形二氧化碳图可以为训练有素的护理人员提供及时、有价值的信息。

基本波形二氧化碳图作为机械通气过程中的持续监测工具

影响呼气末二氧化碳分压 (PetCO2) 的生理因素

有许多因素可能会影响潮气末二氧化碳分压 (PetCO2)。为消除二氧化碳,组织中二氧化碳的产生、血液中二氧化碳的运输、肺泡中的扩散和通过通气消除之间存在着密切、持续的平衡 (Kremeier P, Böhm SH, Tusman G. Clinical use of volumetric capnography in mechanically ventilated patients.J Clin Monit Comput.2020;34(1):7-16. doi:10.1007/s10877-019-00325-91​)。二氧化碳图提供呼出二氧化碳的图形表示,并作为显示机械通气病人二氧化碳动力学实时信息的非侵入性方式。

病人的代谢率升高或降低将导致二氧化碳产生率的变化,因此也会影响 CO2 清除状态。如果循环和通气都是稳定的——这种状态只能在被动机械通气的病人中实现——二氧化碳监测可以用作二氧化碳产生的指标。发烧、败血症、疼痛和癫痫发作都会增加代谢,导致二氧化碳产生相应增加,进而使 PetCO2 增加。代谢下降发生在体温过低、镇静和瘫痪的病人中。这降低了二氧化碳的产生,如果分钟通气量不同时增加,可能会导致 PetCO2 降低 (Gravenstein, J., Jaffe, M., & Paulus, D. (2004). Capnography: Clinical Aspects. New York: Cambridge University Press.2​)。

二氧化碳向肺部的运输依赖于适当的心血管功能;因此,任何改变心血管功能的因素都可能影响二氧化碳向肺部的运输 (Gravenstein, J., Jaffe, M., & Paulus, D. (2004). Capnography: Clinical Aspects. New York: Cambridge University Press.2​)。

从肺部到环境的二氧化碳消除受呼吸功能变化的影响。因此,导致呼吸功能受损的阻塞性肺病、肺炎、神经肌肉疾病和中枢神经系统疾病将影响 PetCO2 值的变化 (Gravenstein, J., Jaffe, M., & Paulus, D. (2004). Capnography: Clinical Aspects. New York: Cambridge University Press.2​)。

二氧化碳图的类型

测量的 CO2 信号可以作为时间函数(基于时间的二氧化碳图)或呼气容量函数(容积二氧化碳图)来记录。这两种不同类型的二氧化碳图可能提供的信息量差异很大。文献中描述了基于时间的二氧化碳图中的某些形式,它们是特定临床情况下的典型形式。下面图 1 显示了一些常见形式。

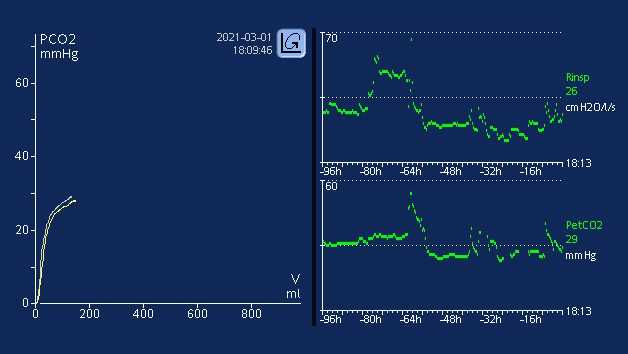
然而,基于时间的二氧化碳图也有局限性:它无法提供对肺部通气-灌注状态的准确估计,也不能用来估计生理死区的组成部分。虽然容积二氧化碳图不如基于时间的二氧化碳图简单方便,但它具有提供更多信息的优势。
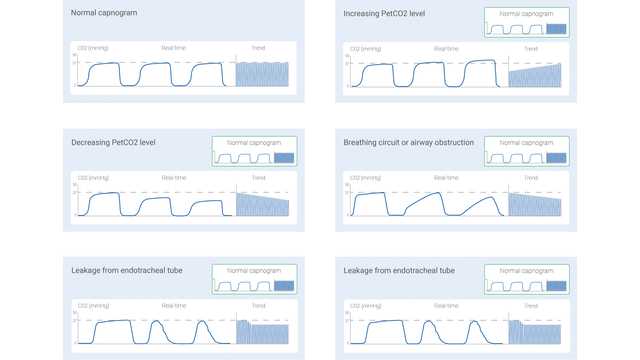
常见状态二氧化碳图显示图
图 1
常见状态二氧化碳图显示图
图 1

容积二氧化碳图——形状和阶段

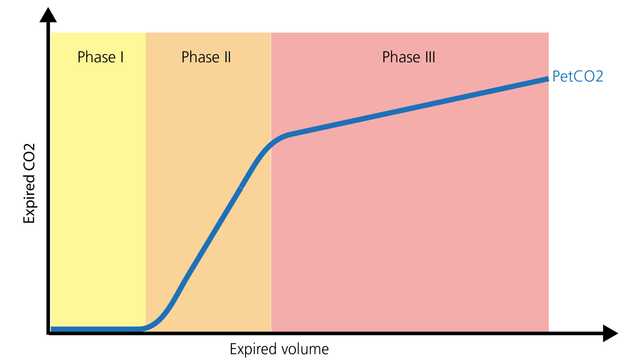
容积二氧化碳图的正常形状包括三个阶段。务必要记住,二氧化碳图代表呼气。

  • 阶段 I 表示来自气道的不含二氧化碳的气体(解剖和仪器死区)。
  • 阶段 II 是一个过渡阶段,在此阶段来自传导性气道的气体与肺泡气体混合。
  • 阶段 III 是一个平台阶段,包括来自肺泡和缓慢排空肺区的气体 (Gravenstein, J., Jaffe, M., & Paulus, D. (2004). Capnography: Clinical Aspects. New York: Cambridge University Press.2​)。下图 2 显示了一个直观图形。
三个阶段显示图
图 2
三个阶段显示图
图 2

转运时的二氧化碳图

二氧化碳图(无论是基于时间的还是容量)可以提供有价值的信息,以优化对需要院内/院间转运的病人的监测和指导护理。只要提供有效的密封,它可以安全地用于气管内插管、气管切开插管和许多声门上气道。气道放置和通畅性、通气监测和灌注状态都是 PetCO2 提供重要信息的方面。另一个有价值的参数是每分钟二氧化碳清除量 (V'CO2),它使护理人员能够评估有效的灌注和容量复苏努力 (I-Gnaidy E., Abo El-Nasr, L., Ameen, S., & Abd El-Ghafar, M. (2019).Correlation between Cardon Dioxide Production and Mean Arterial Blood Pressure in Fluid Response in Mechanically Ventilated Patients. Medical Journal of Cairo University, 87(4), 2679-2684.3​)。

ICU 中的二氧化碳图

在重症监护室,波形二氧化碳图可以通过各种气道辅助设备继续监测气道放置和通畅性。死区与潮气量比率 (VD/Vt) 是一个重要的二氧化碳图测量指标。 VD/Vt 比率升高可基于升高水平表示死亡率的潜在增加 (Kallet RH, Alonso JA, Pittet JF, Matthay MA. Prognostic value of the pulmonary dead-space fraction during the first 6 days of acute respiratory distress syndrome. Respir Care.2004;49(9):1008-1014. 4​, Nuckton TJ, Alonso JA, Kallet RH, et al. Pulmonary dead-space fraction as a risk factor for death in the acute respiratory distress syndrome.N Engl J Med.2002;346(17):1281-1286. doi:10.1056/NEJMoa0128355​)。护理人员可以利用 PetCO2 波形和 V’CO2 来优化肺复张,验证最佳 PEEP 调整,并确定灌注问题(全身和肺部)(Kallet RH, Alonso JA, Pittet JF, Matthay MA.Prognostic value of the pulmonary dead-space fraction during the first 6 days of acute respiratory distress syndrome.Respir Care.2004;49(9):1008-1014.4​, Nuckton TJ, Alonso JA, Kallet RH, et al.Pulmonary dead-space fraction as a risk factor for death in the acute respiratory distress syndrome.N Engl J Med. 2002;346(17):1281-1286. doi:10.1056/NEJMoa0128355​, Blankman P, Shono A, Hermans BJ, Wesselius T, Hasan D, Gommers D. Detection of optimal PEEP for equal distribution of tidal volume by volumetric capnography and electrical impedance tomography during decreasing levels of PEEP in post cardiac-surgery patients. Br J Anaesth. 2016;116(6):862-869. doi:10.1093/bja/aew1166​, Nguyen LS, Squara P. Non-Invasive Monitoring of Cardiac Output in Critical Care Medicine. Front Med (Lausanne).2017;4:200.Published 2017 Nov 20. doi:10.3389/fmed.2017.002007​)。V’CO2 也可用于机械通气撤机,使护理人员能够识别潜在的病人疲劳/衰竭(增加死区比、努力不足和呼吸肌疲劳)。根据 V’CO2 得出能量消耗是一种精确的方法,护理人员可以利用它来计算机械通气病人的营养需求 (Stapel SN, de Grooth HJ, Alimohamad H, et al. Ventilator-derived carbon dioxide production to assess energy expenditure in critically ill patients: proof of concept. Crit Care.2015;19:370.Published 2015 Oct 22. doi:10.1186/s13054-015-1087-28​)。

所有 Hamilton Medical 哈美顿医疗公司呼吸机(除 HAMILTON-MR1 以外的所有型号A​)均可提供容积二氧化碳图,有的是标准功能,有的是可选功能。采用 CAPNOSTAT® 5 主流式 CO2 传感器在病人的气道开口处对二氧化碳进行测量。此外,他们在“监测二氧化碳”窗口提供了所有二氧化碳相关性数据的概览。

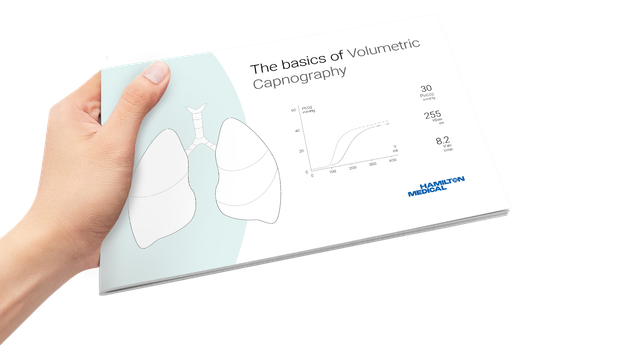
容积二氧化碳图电子书

免费电子书

不可不知! 容积二氧化碳图的详情

学习如何解读容积二氧化碳图及了解容积二氧化碳图的优点和临床应用。包括自测内容!
脚注

  • A. 除 HAMILTON-MR1 以外的所有型号

参考文献

  1. 1. Kremeier P, Böhm SH, Tusman G. Clinical use of volumetric capnography in mechanically ventilated patients. J Clin Monit Comput. 2020;34(1):7-16. doi:10.1007/s10877-019-00325-9
  2. 2. Gravenstein, J., Jaffe, M., & Paulus, D. (2004). Capnography: Clinical Aspects. New York: Cambridge University Press.
  3. 3. I-Gnaidy E., Abo El-Nasr, L., Ameen, S., & Abd El-Ghafar, M. (2019). Correlation between Cardon Dioxide Production and Mean Arterial Blood Pressure in Fluid Response in Mechanically Ventilated Patients. Medical Journal of Cairo University, 87(4), 2679-2684.
  4. 4. Kallet RH, Alonso JA, Pittet JF, Matthay MA. Prognostic value of the pulmonary dead-space fraction during the first 6 days of acute respiratory distress syndrome. Respir Care. 2004;49(9):1008-1014.
  5. 5. Nuckton TJ, Alonso JA, Kallet RH, et al. Pulmonary dead-space fraction as a risk factor for death in the acute respiratory distress syndrome. N Engl J Med. 2002;346(17):1281-1286. doi:10.1056/NEJMoa012835
  6. 6. Blankman P, Shono A, Hermans BJ, Wesselius T, Hasan D, Gommers D. Detection of optimal PEEP for equal distribution of tidal volume by volumetric capnography and electrical impedance tomography during decreasing levels of PEEP in post cardiac-surgery patients. Br J Anaesth. 2016;116(6):862-869. doi:10.1093/bja/aew116
  7. 7. Nguyen LS, Squara P. Non-Invasive Monitoring of Cardiac Output in Critical Care Medicine. Front Med (Lausanne). 2017;4:200. Published 2017 Nov 20. doi:10.3389/fmed.2017.00200
  8. 8. Stapel SN, de Grooth HJ, Alimohamad H, et al. Ventilator-derived carbon dioxide production to assess energy expenditure in critically ill patients: proof of concept. Crit Care. 2015;19:370. Published 2015 Oct 22. doi:10.1186/s13054-015-1087-2

Clinical use of volumetric capnography in mechanically ventilated patients.

Kremeier P, Böhm SH, Tusman G. Clinical use of volumetric capnography in mechanically ventilated patients. J Clin Monit Comput. 2020;34(1):7-16. doi:10.1007/s10877-019-00325-9

Capnography is a first line monitoring system in mechanically ventilated patients. Volumetric capnography supports noninvasive and breath-by-breath information at the bedside using mainstream CO2 and flow sensors placed at the airways opening. This volume-based capnography provides information of important body functions related to the kinetics of carbon dioxide. Volumetric capnography goes one step forward standard respiratory mechanics and provides a new dimension for monitoring of mechanical ventilation. The article discusses the role of volumetric capnography for the clinical monitoring of mechanical ventilation.

Capnography: Clinical Aspects

Gravenstein, J., Jaffe, M., & Paulus, D. (2004). Capnography: Clinical Aspects. New York: Cambridge University Press.

Correlation between Carbon Dioxide Production and Mean Arterial Blood Pressure in Fluid Response in Mechanically Ventilated Patients

I-Gnaidy E., Abo El-Nasr, L., Ameen, S., & Abd El-Ghafar, M. (2019). Correlation between Cardon Dioxide Production and Mean Arterial Blood Pressure in Fluid Response in Mechanically Ventilated Patients. Medical Journal of Cairo University, 87(4), 2679-2684.

Prognostic value of the pulmonary dead-space fraction during the first 6 days of acute respiratory distress syndrome.

Kallet RH, Alonso JA, Pittet JF, Matthay MA. Prognostic value of the pulmonary dead-space fraction during the first 6 days of acute respiratory distress syndrome. Respir Care. 2004;49(9):1008-1014.


BACKGROUND

The ratio of pulmonary dead space to tidal volume (VD/VT) in acute respiratory distress syndrome (ARDS) is reported to be between 0.35 and 0.55. However, VD/VT has seldom been measured with consideration to the evolving pathophysiology of ARDS.

METHODS

We made serial VD/VT measurements with 59 patients who required mechanical ventilation for > or = 6 days. We measured VD/VT within 24 h of the point at which the patient met the American-European Consensus Conference criteria for ARDS, and we repeated the VD/VT measurement on ARDS days 2, 3, and 6 with a bedside metabolic monitor during volume-regulated ventilation. We analyzed the changes in VD/VT over the 6-day period to determine whether VD/VT has a significant association with mortality.

RESULTS

VD/VT was significantly higher in nonsurvivors on day 1 (0.61 +/- 0.09 vs 0.54 +/- 0.08, p < 0.05), day 2 (0.63 +/- 0.09 vs 0.53 +/- 0.09, p < 0.001), day 3 (0.64 +/- 0.09 vs 0.53 +/- 0.09, p < 0.001), and day 6 (0.66 +/- 0.09 vs 0.51 +/- 0.08, p < 0.001).

CONCLUSION

In ARDS a sustained VD/VT elevation is characteristic of nonsurvivors, so dead-space measurements made beyond the first 24 hours may have prognostic value.

Pulmonary dead-space fraction as a risk factor for death in the acute respiratory distress syndrome.

Nuckton TJ, Alonso JA, Kallet RH, et al. Pulmonary dead-space fraction as a risk factor for death in the acute respiratory distress syndrome. N Engl J Med. 2002;346(17):1281-1286. doi:10.1056/NEJMoa012835


BACKGROUND

No single pulmonary-specific variable, including the severity of hypoxemia, has been found to predict the risk of death independently when measured early in the course of the acute respiratory distress syndrome. Because an increase in the pulmonary dead-space fraction has been described in observational studies of the syndrome, we systematically measured the dead-space fraction early in the course of the illness and evaluated its potential association with the risk of death.

METHODS

The dead-space fraction was prospectively measured in 179 intubated patients, a mean (+/-SD) of 10.9+/-7.4 hours after the acute respiratory distress syndrome had developed. Additional clinical and physiological variables were analyzed with the use of multiple logistic regression. The study outcome was mortality before hospital discharge.

RESULTS

The mean dead-space fraction was markedly elevated (0.58+/-0.09) early in the course of the acute respiratory distress syndrome and was higher among patients who died than among those who survived (0.63+/-0.10 vs. 0.54+/-0.09, P<0.001). The dead-space fraction was an independent risk factor for death: for every 0.05 increase, the odds of death increased by 45 percent (odds ratio, 1.45; 95 percent confidence interval, 1.15 to 1.83; P=0.002). The only other independent predictors of an increased risk of death were the Simplified Acute Physiology Score II, an indicator of the severity of illness (odds ratio, 1.06; 95 percent confidence interval, 1.03 to 1.08; P<0.001) and quasistatic respiratory compliance (odds ratio, 1.06; 95 percent confidence interval, 1.01 to 1.10; P=0.01).

CONCLUSIONS

Increased dead-space fraction is a feature of the early phase of the acute respiratory distress syndrome. Elevated values are associated with an increased risk of death.

Detection of optimal PEEP for equal distribution of tidal volume by volumetric capnography and electrical impedance tomography during decreasing levels of PEEP in post cardiac-surgery patients.

Blankman P, Shono A, Hermans BJ, Wesselius T, Hasan D, Gommers D. Detection of optimal PEEP for equal distribution of tidal volume by volumetric capnography and electrical impedance tomography during decreasing levels of PEEP in post cardiac-surgery patients. Br J Anaesth. 2016;116(6):862-869. doi:10.1093/bja/aew116


BACKGROUND

Homogeneous ventilation is important for prevention of ventilator-induced lung injury. Electrical impedance tomography (EIT) has been used to identify optimal PEEP by detection of homogenous ventilation in non-dependent and dependent lung regions. We aimed to compare the ability of volumetric capnography and EIT in detecting homogenous ventilation between these lung regions.

METHODS

Fifteen mechanically-ventilated patients after cardiac surgery were studied. Ventilator settings were adjusted to volume-controlled mode with a fixed tidal volume (Vt) of 6-8 ml kg(-1) predicted body weight. Different PEEP levels were applied (14 to 0 cm H2O, in steps of 2 cm H2O) and blood gases, Vcap and EIT were measured.

RESULTS

Tidal impedance variation of the non-dependent region was highest at 6 cm H2O PEEP, and decreased significantly at 14 cm H2O PEEP indicating decrease in the fraction of Vt in this region. At 12 cm H2O PEEP, homogenous ventilation was seen between both lung regions. Bohr and Enghoff dead space calculations decreased from a PEEP of 10 cm H2O. Alveolar dead space divided by alveolar Vt decreased at PEEP levels ≤6 cm H2O. The normalized slope of phase III significantly changed at PEEP levels ≤4 cm H2O. Airway dead space was higher at higher PEEP levels and decreased at the lower PEEP levels.

CONCLUSIONS

In postoperative cardiac patients, calculated dead space agreed well with EIT to detect the optimal PEEP for an equal distribution of inspired volume, amongst non-dependent and dependent lung regions. Airway dead space reduces at decreasing PEEP levels.

Non-Invasive Monitoring of Cardiac Output in Critical Care Medicine.

Nguyen LS, Squara P. Non-Invasive Monitoring of Cardiac Output in Critical Care Medicine. Front Med (Lausanne). 2017;4:200. Published 2017 Nov 20. doi:10.3389/fmed.2017.00200

Critically ill patients require close hemodynamic monitoring to titrate treatment on a regular basis. It allows administering fluid with parsimony and adjusting inotropes and vasoactive drugs when necessary. Although invasive monitoring is considered as the reference method, non-invasive monitoring presents the obvious advantage of being associated with fewer complications, at the expanse of accuracy, precision, and step-response change. A great many methods and devices are now used over the world, and this article focuses on several of them, providing with a brief review of related underlying physical principles and validation articles analysis. Reviewed methods include electrical bioimpedance and bioreactance, respiratory-derived cardiac output (CO) monitoring technique, pulse wave transit time, ultrasound CO monitoring, multimodal algorithmic estimation, and inductance thoracocardiography. Quality criteria with which devices were reviewed included: accuracy (closeness of agreement between a measurement value and a true value of the measured), precision (closeness of agreement between replicate measurements on the same or similar objects under specified conditions), and step response change (delay between physiological change and its indication). Our conclusion is that the offer of non-invasive monitoring has improved in the past few years, even though further developments are needed to provide clinicians with sufficiently accurate devices for routine use, as alternative to invasive monitoring devices.

Ventilator-derived carbon dioxide production to assess energy expenditure in critically ill patients: proof of concept.

Stapel SN, de Grooth HJ, Alimohamad H, et al. Ventilator-derived carbon dioxide production to assess energy expenditure in critically ill patients: proof of concept. Crit Care. 2015;19:370. Published 2015 Oct 22. doi:10.1186/s13054-015-1087-2


INTRODUCTION

Measurement of energy expenditure (EE) is recommended to guide nutrition in critically ill patients. Availability of a gold standard indirect calorimetry is limited, and continuous measurement is unfeasible. Equations used to predict EE are inaccurate. The purpose of this study was to provide proof of concept that EE can be accurately assessed on the basis of ventilator-derived carbon dioxide production (VCO2) and to determine whether this method is more accurate than frequently used predictive equations.

METHODS

In 84 mechanically ventilated critically ill patients, we performed 24-h indirect calorimetry to obtain a gold standard EE. Simultaneously, we collected 24-h ventilator-derived VCO2, extracted the respiratory quotient of the administered nutrition, and calculated EE with a rewritten Weir formula. Bias, precision, and accuracy and inaccuracy rates were determined and compared with four predictive equations: the Harris-Benedict, Faisy, and Penn State University equations and the European Society for Clinical Nutrition and Metabolism (ESPEN) guideline equation of 25 kcal/kg/day.

RESULTS

Mean 24-h indirect calorimetry EE was 1823 ± 408 kcal. EE from ventilator-derived VCO2 was accurate (bias +141 ± 153 kcal/24 h; 7.7 % of gold standard) and more precise than the predictive equations (limits of agreement -166 to +447 kcal/24 h). The 10 % and 15 % accuracy rates were 61 % and 76 %, respectively, which were significantly higher than those of the Harris-Benedict, Faisy, and ESPEN guideline equations. Large errors of more than 30 % inaccuracy did not occur with EE derived from ventilator-derived VCO2. This 30 % inaccuracy rate was significantly lower than that of the predictive equations.

CONCLUSIONS

In critically ill mechanically ventilated patients, assessment of EE based on ventilator-derived VCO2 is accurate and more precise than frequently used predictive equations. It allows for continuous monitoring and is the best alternative to indirect calorimetry.

Related articles. Get a deeper look