作者: Karjaghli Munir, Respiratory Therapist, Hamilton Medical Clinical Application Specialist; Matthias Himmelstoss, ICU Nurse, MSc Physics, Product Manager
日期: 16.11.2023
Learn everything you need to know in our guide to volumetric capnography: the volumetric capnogram, the capnography phases, what is dead space, the difference between anatomical dead space and alveolar dead space, PetCO during bronchospasm, V‘CO and CO2 elimination, and more.

Carbon dioxide (CO2) is the most abundant gas produced by the human body. CO2 is the primary drive to breathe and a primary motivation for mechanically ventilating a patient. Monitoring the CO2 level during respiration (capnography) is noninvasive, easy to do, relatively inexpensive, and has been studied extensively.
Capnography has improved over the last few decades thanks to the development of faster infrared sensors that can measure CO2 at the airway opening in real time. By knowing how CO2 behaves on its way from the bloodstream through the alveoli to the ambient air, physicians can obtain useful information about ventilation and perfusion.
There are two distinct types of capnography: Conventional, time-based capnography allows only qualitative and semi-quantitative, and sometimes misleading, measurements, so volumetric capnography has emerged as the preferred method to assess the quality and quantity of ventilation.
In short, volumetric capnography is a valuable tool to improve the ventilation quality and efficiency for your ventilated patients.
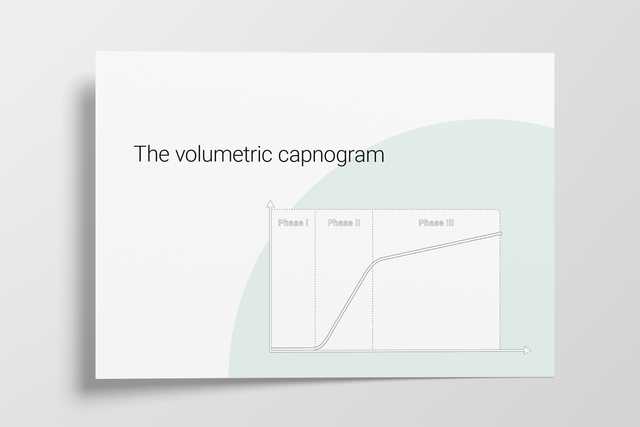
The alveolar concentration of carbon dioxide (CO2) is the result of metabolism, cardiac output, lung perfusion, and ventilation. Change in the concentration of CO2 reflects perturbations in any or a combination of these factors. Volumetric capnography provides continuous monitoring of CO2 production, ventilation/perfusion (V/Q) status, and airway patency, as well as function of the ventilator breathing circuit itself.
Expired gas receives CO2 from three sequential compartments of the airways, forming three recognizable phases on the expired capnogram. A single-breath curve in volumetric capnography exhibits these three characteristic phases of changing gas mixtures - they refer to the airway region in which they originate:
Using features from each phase, physiologic measurements can be calculated.
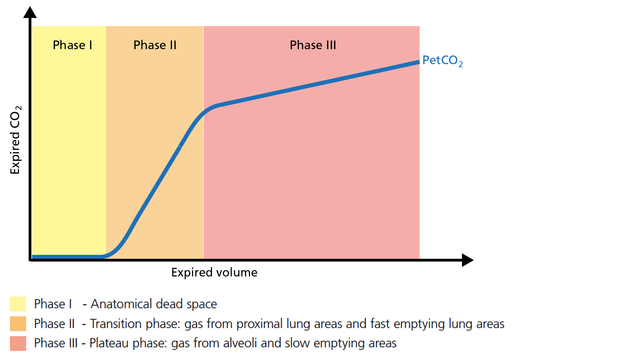
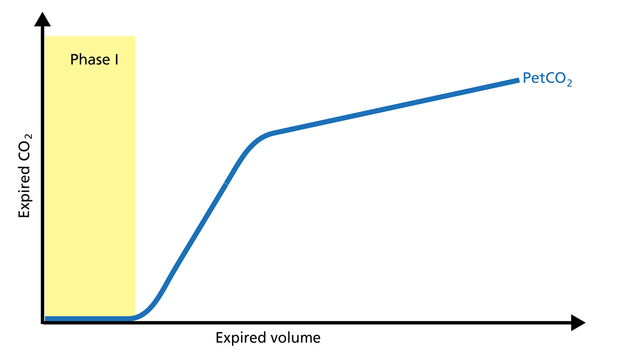
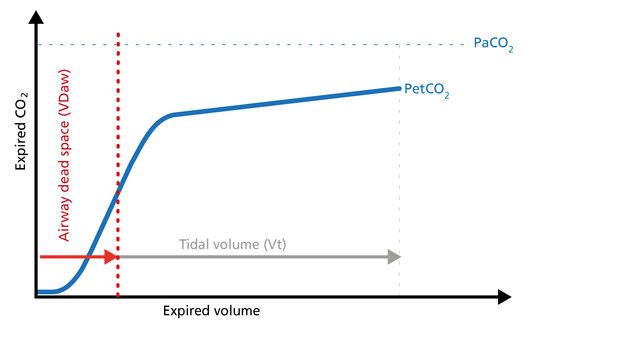
The first gas that passes the sensor at the onset of expiration comes from the airways and the breathing circuit where no gas exchange has taken place = anatomical + artificial dead space. This gas usually does not contain any CO2. Hence the graph shows movement along the X-axis (expired volume), but no gain in CO2 on the Y-axis (Figure 2).
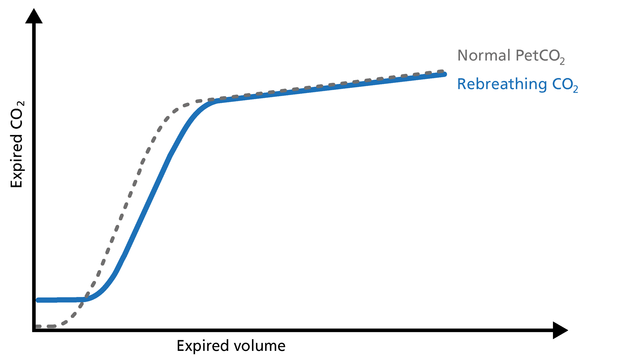
Good to know: A prolonged Phase I indicates an increase in anatomical dead space ventilation (VDaw). Presence of CO2 during Phase I indicates rebreathing or that the sensor needs to be recalibrated.
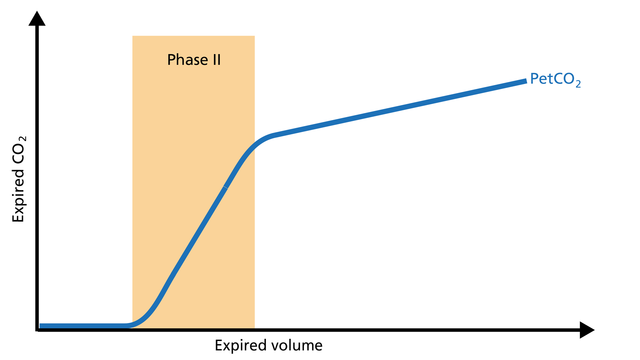
Phase II represents gas that is composed partially of distal airway volume and mixed with gas from fast- emptying alveoli. The curve slope represents transition velocity between distal airway and alveolar gas – providing information about perfusion changes and also about airway resistances (Figure 3).
Good to know: A prolonged Phase II can indicate an increase in airway resistance and/or a Ventilation/Perfusion (V/P) mismatch.
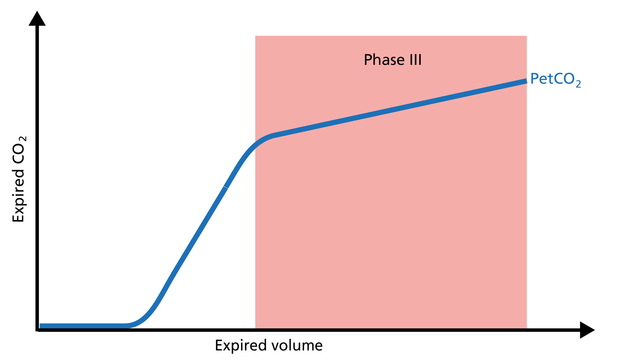
Phase III gas is entirely from the alveoli where the gas exchange takes place. This phase is representative of gas distribution. The final CO2 value in Phase III is called end-tidal CO2 (PetCO2) (Figure 4).
Good to know: A steep slope in Phase III provides information about lung heterogeneity with some fast- and some slow-emptying lung areas. For example, an obstructed airway results in insufficiently ventilated alveoli, inducing high CO2 values and increased time constants in this region.
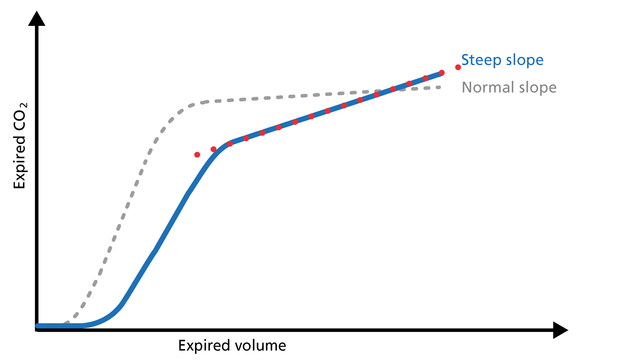
The slope of Phase III is a characteristic of the volumetric capnogram shape. This slope is measured in the geometric center of the curve, which is defined as the middle two quarters lying between VDaw and the end of exhalation (Figure 5).
Good to know: In Phase III, a steep slope can be seen, for example, in COPD and ARDS patients.
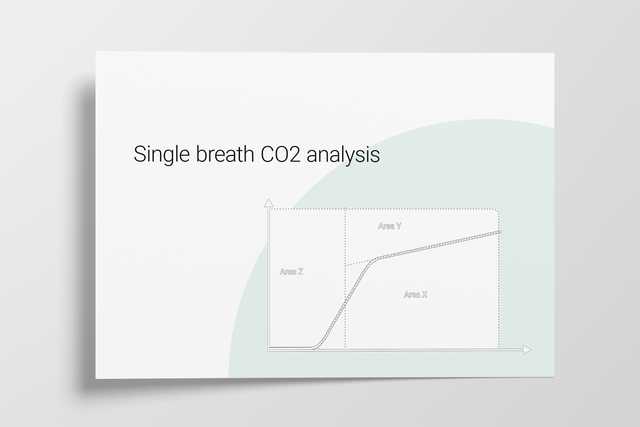
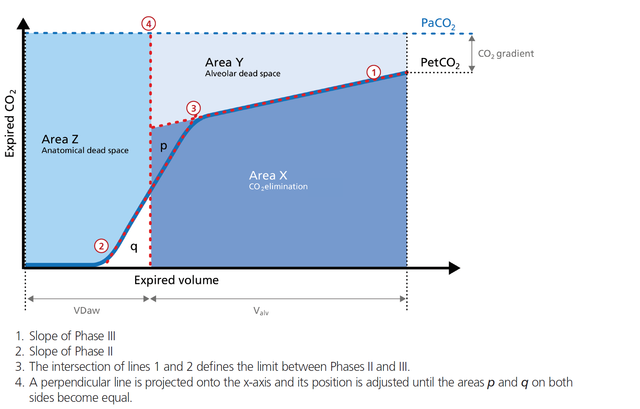
The volumetric capnogram can also be divided into three areas:
The size of the areas, as well as the form of the curve, can give you more insight into the patient‘s lung condition regarding:
In the illustration (Figure 6) you can see:
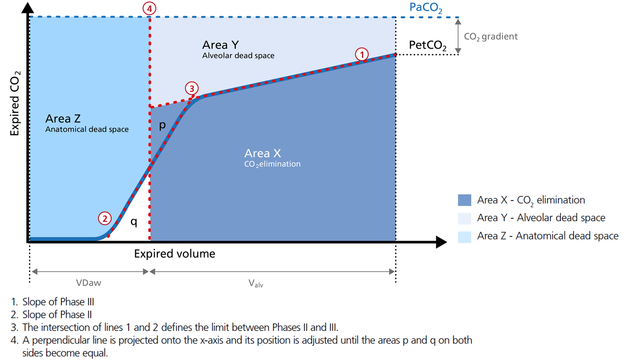
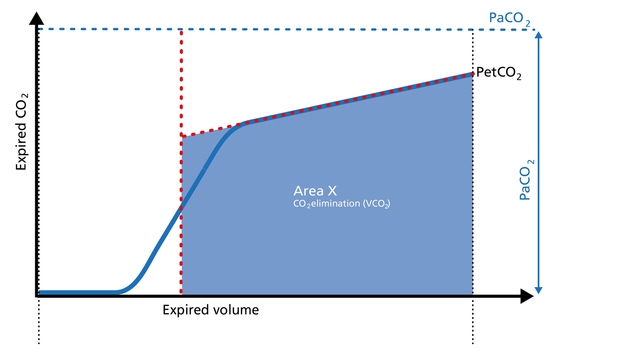
Area X represents the actual volume of CO2 exhaled in one breath (VeCO2). Adding up all of the single breaths in one minute gives you the total elimination of CO2 per minute (V‘CO2). If cardiac output, lung perfusion, and ventilation are stable, this is an assessment of the production of CO2 called V‘CO2. The V‘CO2 value displayed on the ventilator can be affected by any change in CO2 production, cardiac output, lung perfusion, and ventilation. It indicates instantly how the patient’s gas exchange responds to a change in ventilator settings. Monitoring trends allows for detection of sudden and rapid changes in V‘CO2 (Figure 7).
Good to know:
Decreasing V‘CO2: Hypothermia, deep sedation, hypothyroidism, paralysis, and brain death decrease CO2 production and induce a decrease in V‘CO2. Decreasing V‘CO2 can also be due to a decrease in cardiac output or blood loss, and may also suggest a change in blood flow to the lung areas. Pulmonary embolism, for example, exhibits V‘CO2 reduction and a slope reduction in Phase II.
Increase in V‘CO2: An increase in V'CO2 is usually due to bicarbonate infusion or an increase in CO2 production that can be caused by:
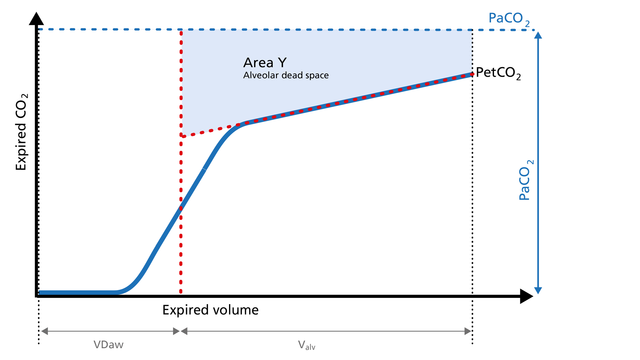
Area Y represents the amount of CO2 that is not eliminated due to alveolar dead space (Figure 8).
Good to know:
Increase: Alveolar dead space is increased in cases of lung emphysema, lung overdistension, pulmonary embolism, pulmonary hypertension, and cardiac output compromise.
Decrease: If the above mentioned conditions improve due to successful therapy, the alveolar
dead space decreases.
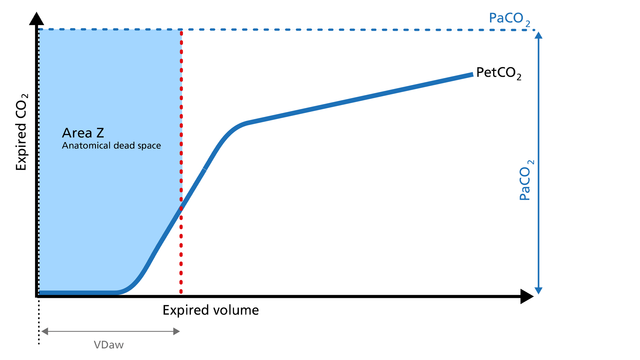
Anatomical dead space measurement using a volumetric capnogram gives an effective, in-vivo measure of volume lost in the conducting airway. This area represents a volume without CO2. It does not take part in the gas exchange and consists of the airway, endotracheal tube, and artificial accessories, such as a flextube positioned between the CO2 sensor and the patient (Figure 9).
Good to know:
Expansion of Area Z: An expansion of Area Z can indicate an increase in anatomical dead space ventilation (VDaw). Consider a reduction in your artificial dead space volume.
Diminution of Area Z: A diminution of Area Z is seen when the artificial dead space volume is decreased and when excessive PEEP is decreased.
Phase III of the waveform represents the quantity of gas that comes from the alveoli and actively participates in gas exchange. V‘alv is calculated by subtracting the anatomical dead space (VDaw) from the tidal volume (VTE) multiplied by the respiratory rate from the minute volume (MinVol): V’alv =RR*Vtalv = RR*(VTE-VDaw) (Figure 10).
Good to know:
Increase: An increase in V‘alv is seen after an efficient recruitment maneuver and induces a transient increase in V‘CO2.
Decrease: A decrease in V‘alv can indicate that fewer alveoli are participating in the gas exchange, for example, due to pulmonary edema.
The ratio of airway dead space (VDaw) to tidal volume (VTE) – the VDaw/VTE ratio – gives you an insight into the effectiveness of ventilation (Figure 11).
Good to know: A rising VDaw/VTE ratio can be a sign of ARDS.

You can use the insights from the CO2 curve to improve ventilation quality and efficiency for your patients. Below you will find examples of use of the CO2 curve for the following clinical scenarios:
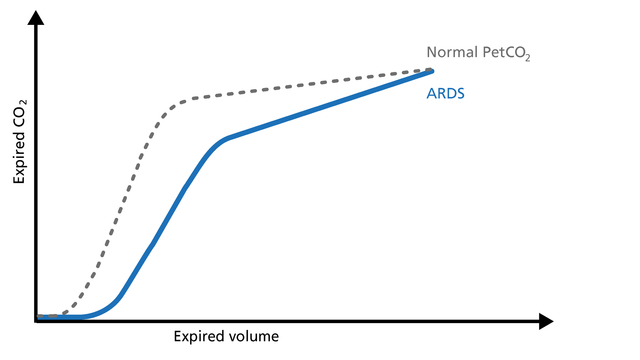
In ARDS, the ventilation/perfusion ratio is disturbed and changes in the slope of the volumetric capnogram curve can be observed (Figure 12).
Good to know: Phase I is larger due to increased anatomical dead space caused by PEEP. The slope of Phase II is decreased due to lung perfusion abnormalities. The slope of Phase III is increased due to lung heterogeneity.
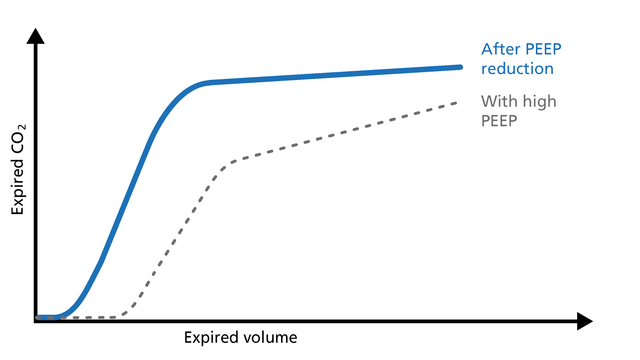
If PEEP is too high, the intrathoracic pressure rises, the venous return decreases, and pulmonal vascular resistance (PVR) increases. These changes can easily be observed on the volumetric capnogram (Figure 13). The clinician can use volumetric capnography to check and manage the PEEP setting.
Good to know:
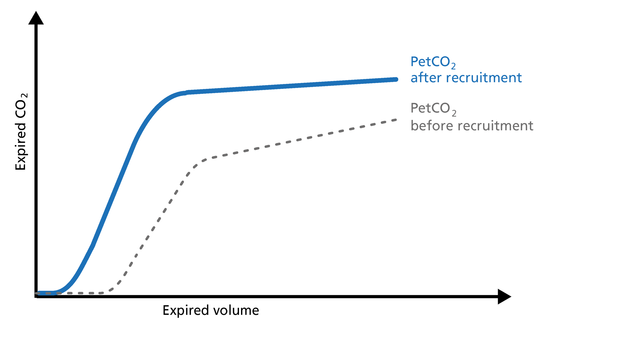
The volumetric capnogram can be used to assess the effectiveness of recruitment maneuvers and might give you an insight into the recruited lung volume (Figure 14).
Good to know: After a successful recruitment maneuver, you should see a transient increase in V‘CO2. Phase I may decrease a little. The slope of Phase II becomes steeper with improved lung perfusion. The slope of Phase III improves as a result of more homogeneous lung emptying.

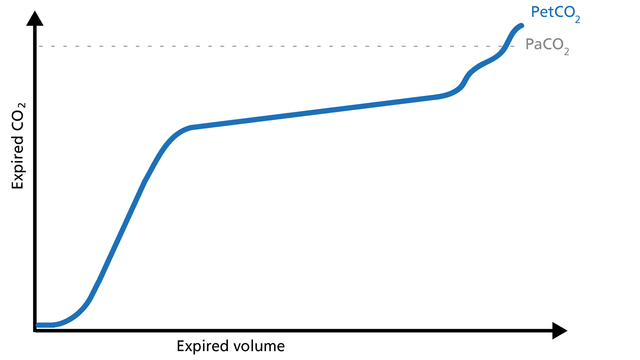
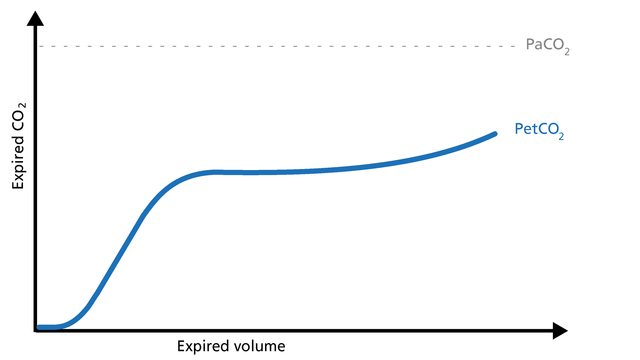
Concave Phase III volumetric capnograms have been seen with obese patients and patients with increased expiratory resistance. Obese patients (Figure 15) can have biphasic emptying and higher PetCO2 than PaCO2. That difference suggests varying mechanical and ventilation/perfusion properties. The increase in expiratory resistance (Figure 16) may reflect a slow expiratory phase with a slow accumulation of alveolar CO2. The alveoli that empty last may have more time for CO2 diffusion.
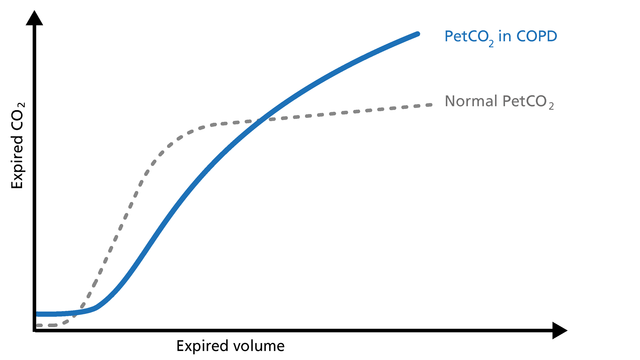
When spirometry cannot be performed reliably, volumetric capnography can be used as an alternative test to evaluate the degree of functional involvement in obstructive lung disease patients (COPD, asthma, cystic fibrosis, etc.). Obstructive lung disease is characterized by asynchronous emptying of compartments with different ventilation/perfusion ratios (Figure 17).
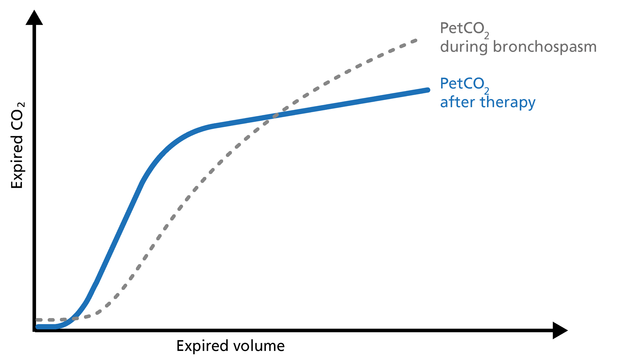
Patients with high airway resistance demonstrate a decrease in the Phase II slope and a steep slope in Phase III. The volumetric capnogram can give you insights into therapy efficiency (Figure 18).
Good to know: The volumetric capnogram in COPD patients shows a prolonged Phase II, an increase in PetCO2, and a continuously ascending slope without a plateau in Phase III (Figure 17).
A Phase II shift to the left indicates reduced resistance. The slope of Phase III shows a decrease in steepness indicating better gas distribution and reduced alveolar dead space (VDalv) (Figure 18).
Pulmonary embolism (PE) leads to an abnormal alveolar dead space that is expired in synchrony with gas from normally perfused alveoli. This feature of PE separates it from pulmonary diseases affecting the airway, which are characterized by nonsynchronous emptying of compartments with an uneven ventilation/perfusion relationship. In the case of sudden pulmonary embolism, volumetric capnography has a typical unique shape (Figure 19).
Good to know: In patients with sudden pulmonary vascular occlusion due to pulmonary embolism, Phase I is increased due to increased anatomical dead space. The slope of Phase II is decreased due to poor lung perfusion. Phase III has a normal plateau with low PetCO2 because the number of functional alveoli is reduced. In this case, V‘CO2 drops suddenly.
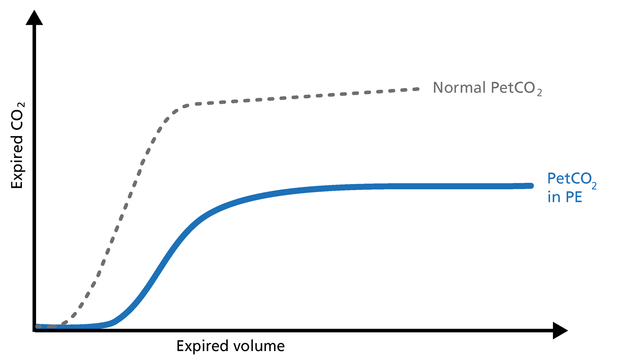
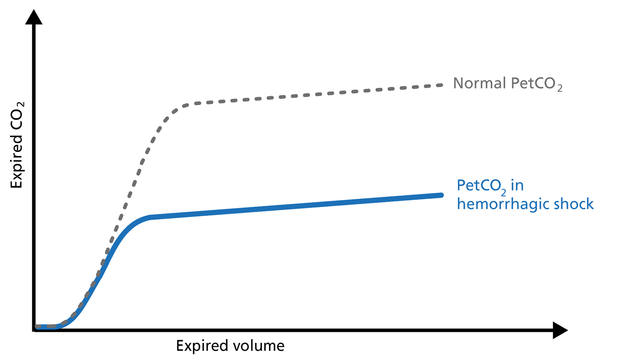
Hemorrhagic shock is a condition of reduced tissue perfusion, resulting in the inadequate delivery of oxygen and nutrients that are necessary for cellular function (Figure 20).
Good to know: The expired CO2 drops drastically. Phase I is unchanged and the slopes of Phase II and III are unchanged, but PetCO2 is decreased due to the increase in alveolar dead space.
The volumetric capnogram and trends show the patient‘s response to the weaning trial and allow for better management of the weaning process.
Indications for a successful weaning trial are:
Indications for an unsuccessful weaning trial are:
If arterial access is not something you routinely perform when you transport a ventilated patient, PetCO2 can be used for monitoring perfusion and ventilation during transport.
Good to know: A decrease in PetCO2 accompanied by a decrease of VCO2 can signify:
An elevation of the baseline during Phase I indicates rebreathing of CO2, which may be due to mechanical problems or therapeutic use of mechanical dead space (Figure 21).
Good to know: In this case, consider recalibrating the CO2 sensor or reducing the airway accessories.

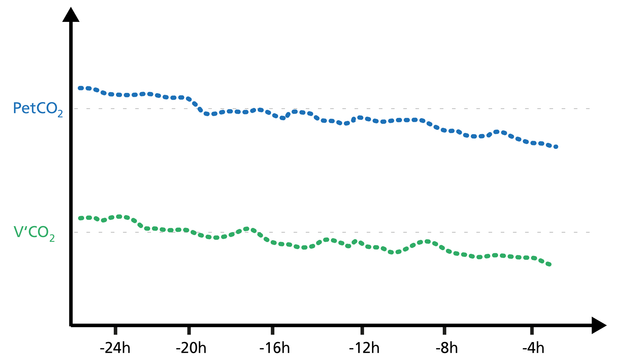
Trending PetCO2 and V’CO2 is a good way to see potential changes in the patient’s condition.
If the PetCO2 trend moves up while the V‘CO2 trend decreases for a while and then returns to baseline, this indicates a worsening of ventilation.
If the PetCO2 trend moves down while the V‘CO2 trend increases for a while and then returns to baseline, this indicates an improvement in ventilation (Figure 22).
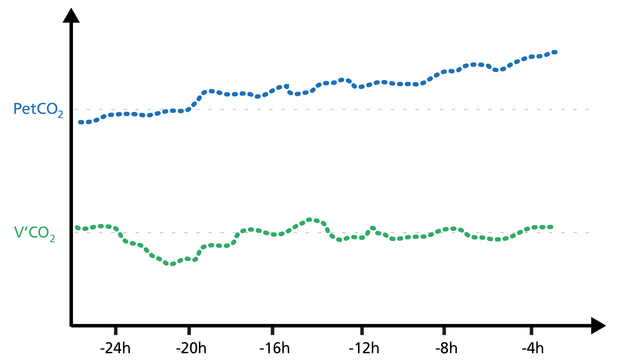
Rising PetCO2 and V‘CO2 trends indicate increasing CO2 production (agitation, pain, fever).
Falling PetCO2 and V‘CO2 trends indicate a decrease in CO2 production (Figure 23).
When a PEEP change is associated with an improving ventilation/perfusion ratio, V‘CO2 shows a transient increase for a couple of minutes and then returns back to baseline, that is, in equilibrium with CO2 production.
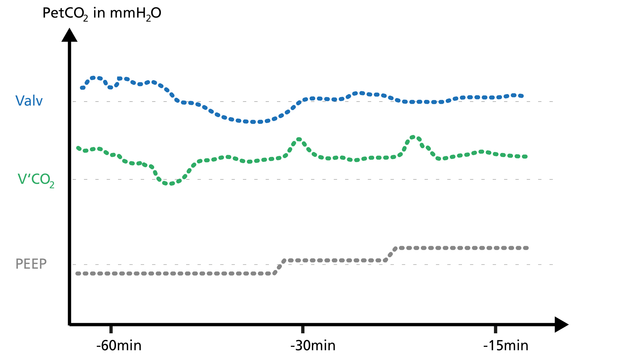
When a PEEP change is associated with a worsening of the ventilation/perfusion ratio, V‘CO2 transiently decreases for a few minutes and then returns to baseline (Figure 24). The clinician can use volumetric capnography to check and manage the PEEP setting.
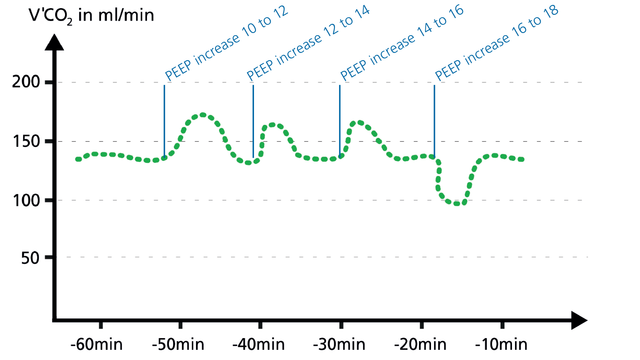
Volumetric CO2 provides continuous monitoring to detect derecruitment and recruitment of alveoli.
Alveolar ventilation and V‘CO2 will first decrease if the lung derecruits, and will then stabilize again at equilibrium.
Recruitment, for example during a PEEP increase, can be detected by short V‘CO2 peaks before V‘CO2 returns to equilibrium (Figure 25).
All Hamilton Medical ventilators offer volumetric capnography (
Full citations below: (

学习如何解读容积二氧化碳图及了解容积二氧化碳图的优点和临床应用。包括自测内容!

Waveform capnography is no stranger to intensive care/critical care medicine. It is a widely utilized airway management validation tool and is used extensively in the conscious sedation environment, as well as during interfacility transport of intubated patients requiring mechanical ventilation. Waveform capnography can provide timely, valuable information to a well-trained caregiver.
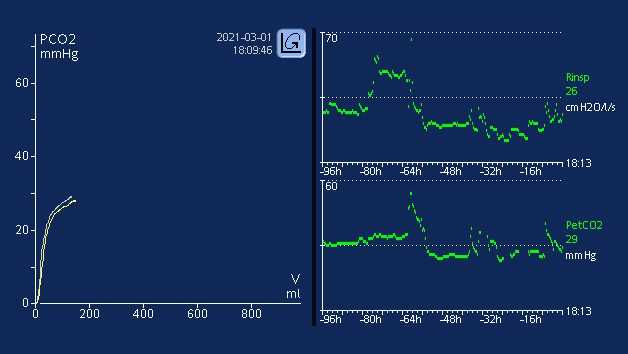
It is well established that metabolism, perfusion, and efficient lung function are paramount to effective CO2 transport and elimination (1). Changes in a patient’s metabolic state, perfusion, or lung function can affect CO2 elimination, sometimes drastically.
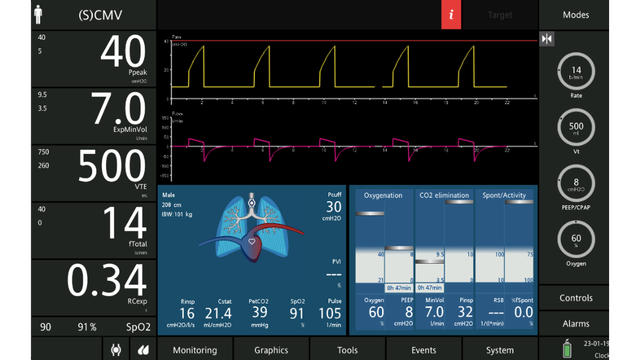
Ventilation is effective when it removes CO2 at a rate that maintains a normal or a targeted pH.
How do Hamilton Medical ventilators calculate V`alv and VDaw/VTE, and what are these parameters used for?