Author: Branka Cupic, Caroline Brown
Date of first publication: 29.06.2022
The first step to identifying asynchronies using standard ventilator waveforms is knowing what a synchronous breath looks like during pressure-support ventilation.

A recent study showed that clinicians can use the analysis of standard ventilator waveforms to detect respiratory activity and asynchronies between the patient and ventilator with high sensitivity and specificity (
Around these principles, the authors created a set of pre-defined rules that they applied systematically to detect the patient’s respiratory activity and identify asynchronies from the airway pressure and flow waveforms. Esophageal pressure (Pes) was used as a reference.
In this bedside tip, we start with a normal breath and how to recognize good synchrony between the patient and ventilator. In future Bedside tips, we will show you how to identify the most common minor and major asynchronies.
An important part of being able to identify the beginning and end of the patient's inspiratory effort is recognizing exponential decay of flow. An exponential change describes the process whereby an amount decreases or increases by a consistent percentage rate over a period of time (i.e., the rate of change is proportional to its current value). It occurs in many physical situations.
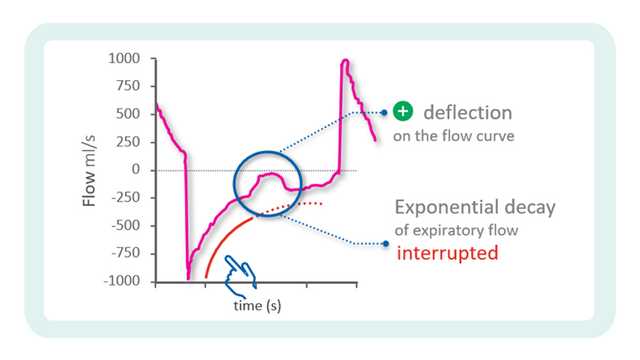
As described in the principles above, exponential decay of flow suggests a passive condition. The shape on the waveform will be different, depending on whether, after the initial peak flow, it is a decrease in inspiratory flow (Figure 1 - left panel) or expiratory flow (Figure 1 - right panel).
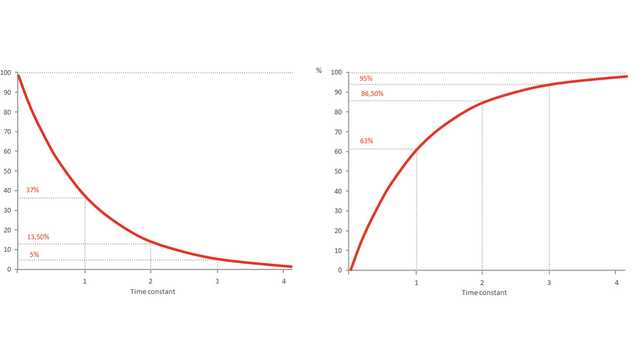
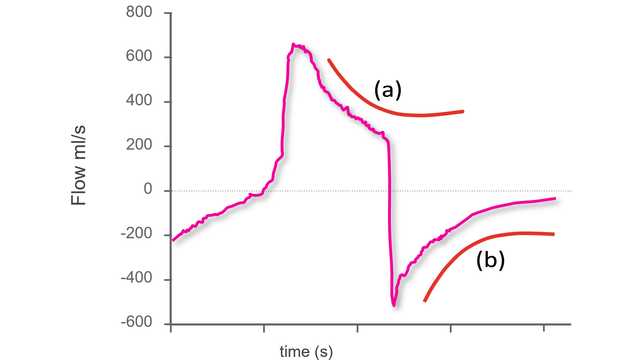
Figure 2 shows two instances of exponential decay:
a) During inspiration: This is not normal during pressure-support ventilation, as inspiration should be active.
b) During expiration: This is as expected, as expiration is passive.
N.B.: The inspiration shown below is intially active and then becomes passive. The change between the two phases is evident from the change of slope on the waveform.

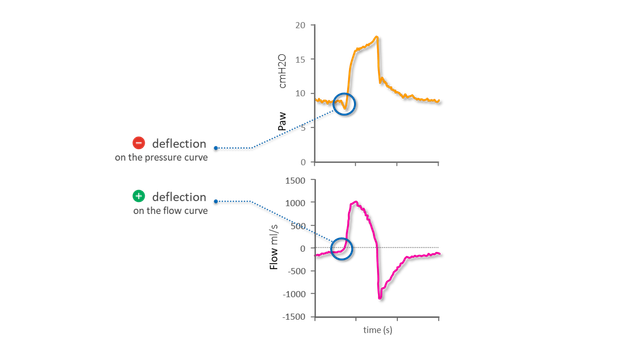
Identifiying the start of an inspiratory effort (Figure 3)
On the pressure and flow waveforms, the start of the patient’s inspiratory effort is indicated by:
a) a sudden negative deflection of Paw interrupting a phase of stable airway pressure
b) a sudden positive deflection of Flow interrupting a phase of exponential decay
The inspiratory flow profile shows an upwards convexity after the peak, with flow dropping more and more quickly. When the inspiratory effort is close to its end, flow crosses the zero line and moves straight towards its expiratory peak. This is then followed by exponential decay.
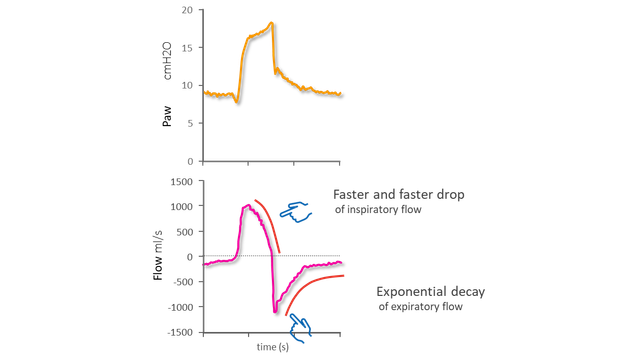
As shown above, it is possible to identify the start and end of an inspiratory effort without needing the Pes waveform. In the above-mentioned study, it was used as a reference to assess the accuracy of the waveform analysis. Below you can see the beginning and end of inspiration on the Pes waveform and the excellent agreement between Pes and the flow and pressure waveforms.
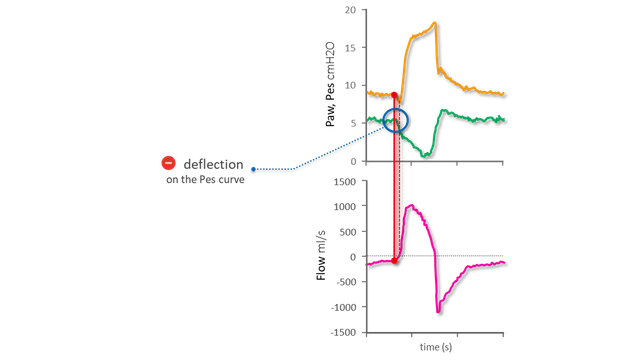
On the Pes reference waveform (shown in green), the start of the patient’s inspiratory effort is indicated by a sudden negative deflection on the Pes curve (see Figure 5).
The steep rise in both pressure and flow soon after indicates the start of the mechanical breath.
If the time gap between the two is very short, patient and ventilator are in synchrony. A longer gap (e.g., > 250 milliseconds) is considered a trigger delay.
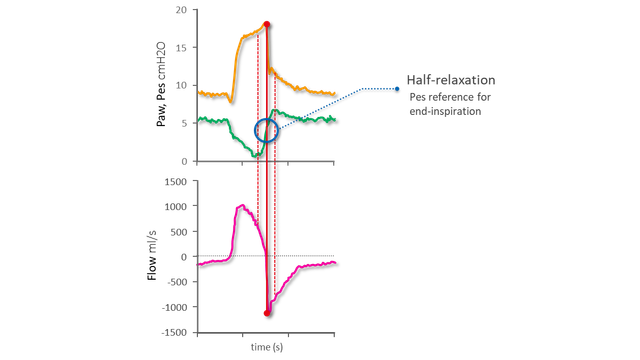
Figure 6 shows the fast increase in Pes after its nadir that corresponds to the relaxation of the inspiratory muscles: its midpoint is the reference for the end of inspiration.

Our asynchrony reference card gives you an overview of the most common asynchrony types, their causes, and how to detect them.

Asynchrony between patient and ventilator is a common occurrence in mechanically ventilated patients (1, 2).
In the previous issue, our Bedside tip covered the starting point for identifying asynchronies using ventilator waveforms.