Author: Joe Hylton, MA, BSRT, RRT-ACCS/NPS, NRP, FAARC, FCCM, Clinical Applications Specialist, Hamilton Medical Inc.
Date of first publication: 15.07.2021
It is well established that metabolism, perfusion, and efficient lung function are paramount to effective CO2 transport and elimination (1). Changes in a patient’s metabolic state, perfusion, or lung function can affect CO2 elimination, sometimes drastically.

Basic waveform capnography gives clinicians the ability to continually monitor partial pressure of end-tidal CO2 (PetCO2), and potentially identify changes in the overall status of the mechanically ventilated patient.
Hamilton Medical ventilators utilizing sidestream or mainstream CO2 monitoring offer an integrated PetCO2 waveform and provide clinicians with the ability to monitor PetCO2. The clinician can compare the capnography waveform with the pressure and flow waveforms in real-time, to potentially assist in identifying problems that may occur (e.g., increased airway resistance, increased dead space, airway leaks) (
When initiating CO2 measurement, it is best to obtain an arterial blood gas, in order to compare the PaCO2 with the PetCO2. With normal physiology, the PaCO2-PetCO2 gradient should be 2-5 mmHg. The acceptable normal ranges for PetCO2 are the same as an arterial blood gas, 35-45 mmHg. If the gradient exceeds 5 mmHg, the clinician should assess for any possible physiologic and equipment factors that may affect the PetCO2 reading. Disease states such as ARDS, heart failure/pulmonary edema, asthma, COPD/emphysema, low perfusion conditions (shock/hypotension, sepsis, myocardial infarction, heart failure) and pulmonary embolism can contribute to a widened PaCO2-PetCO2 gradient.
Correcting a ventilation/perfusion mismatch, such as reversing shock/hypotension (reducing dead space), or utilizing a recruitment maneuver and adjusting PEEP in ARDS (reducing shunt) can decrease the PaCO2-PetCO2 gradient to a more acceptable range (

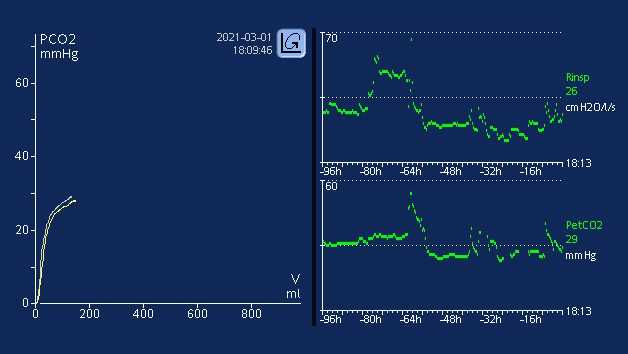
Trending PetCO2 and V’CO2 is a good way to see potential changes in the patient’s condition. A change in the patient’s temperature (e.g., hyperthermia/fever), or a decrease in cardiac output/blood pressure (e.g., bradycardia, neurogenic/hemorrhagic shock) can cause potential changes in CO2 elimination. The ability to trend PetCO2 and V’CO2 may allow the clinician to identify potential changes earlier, or allow the team to better identify when an event occurred. The ability for clinicians to intervene when critical events may be occurring, or the ability to better identify when an event occurred can provide information that is critical to patient outcomes. Trending PetCO2 and V’CO2 can be an effective diagnostic tool to show the benefit of resuscitation maneuvers (vascular volume replacement, improving systemic vascular resistance to improve dead space), or when recruitment maneuvers and PEEP titration are done to potentially decrease shunt phenomenon. Hamilton Medical ventilators offer clinicians the option to trend the following CO2 monitoring parameters for up to 96-hour periods (on HAMILTON-G5/S1; HAMILTON-C1/C3/C6/T1 up to 72 hours): PetCO2, V‘CO2, FetCO2, VeCO2, ViCO2, VTE/Vtalv, VDaw, VD/Vt, and slopeCO2. These can be plotted against any of the other monitoring parameters available. Trending can be performed in real-time with the Ventilation Cockpit smart panel views.
Full citations below: (


Learn how to interpret a volumetric capnogram and get an overview of the benefits and clinical applications of volumetric capnography. Includes a self-test!