Wir haben festgestellt, dass Sie unsere Website von China aus besuchen.
Für Ihr Land (China) gibt es eine eigene Version der Website.

Zu China wechseln
 Technologien

Volumetrische Kapnographie. Anspruchsvolle CO2-Messung

Grafische Darstellung: Lupe

Für einen besseren Einblick. Volumetrisches CO2-Monitoring

Die Phasen eines volumetrischen Kapnogramms, die Form und die Kurvenmorphologie sowie die Messungen, die auf den Berechnungen basieren, können Ihnen wichtige Informationen über Folgendes liefern:
  • Ventilations-Perfusions-Effizienz
  • Physiologische Totraumfraktion
  • Metabolische Rate des Patienten (Jaffe MB. Using the features of the time and volumetric capnogram for classification and prediction. J Clin Monit Comput. 2017;31(1):19-41. doi:10.1007/s10877-016-9830-z1​)
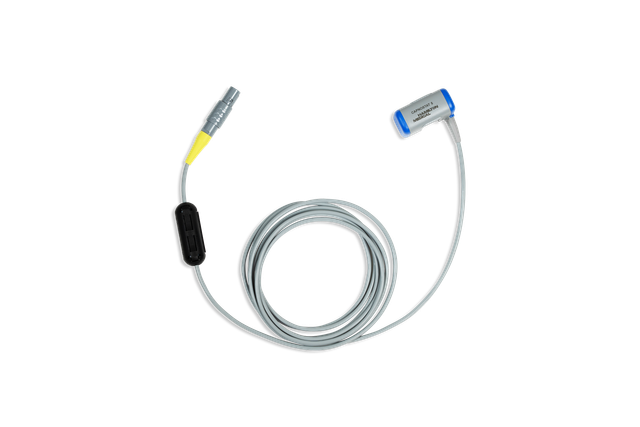
CAPNOSTAT-5 Hauptstrom-CO2-Sensor

Ein mächtiges Tool. Der CO2-Sensor

Bei unseren Beatmungsgeräten wird das CO2 mit einem CAPNOSTAT-5 Hauptstrom-CO2-Sensor proximal zum Atemweg des Patienten gemessen.

Der CAPNOSTAT-5 Sensor liefert präzise Messungen des endtidalen Kohlendioxids (PetCO2) und ein klares, genaues Kapnogramm bei allen Atemfrequenzen von bis zu 150 Atemzügen pro Minute.
Statistische Grafik: Analyse der CO2-Sensordaten

Kleiner Sensor, grosse Daten. Das Ergebnis kann sich sehen lassen

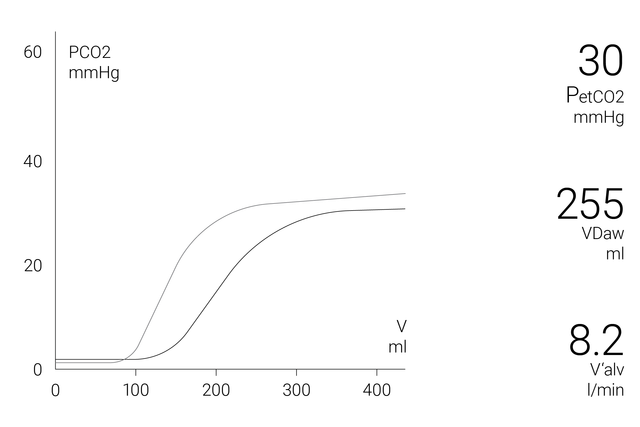
Das volumetrische Kapnogramm-Fenster auf dem Bildschirm zeigt genaue quantitative Informationen als Kombination von proximalen Flow- und proximalen CO2-Daten an, wie z. B.:

  • Aktuelle volumetrische Kapnogramm-Kurve
  • Volumetrische Kapnogramm-Referenzkurve
  • Referenzkurven-Taste mit Zeit und Datum des Referenz-Loops
  • Die wichtigsten CO2-Werte, Atemzug für Atemzug

Um eine umfassendere Analyse des Patientenzustands zu ermöglichen, steht ein 72-Stunden-Trend (bzw. ein 96-Stunden-Trend beim HAMILTON-G5/S1) für folgende Werte zur Verfügung:

  • PetCO2
  • V’CO2
  • FetCO2
  • VeCO2
  • ViCO2
  • VTalv
  • VTalv/min
  • Vds
  • Vds/Vt
  • Vds/VTE
  • SlopeCO2

Um Ihnen das Leben zu erleichtern, bieten die Beatmungsgeräte von Hamilton Medical im CO2-Monitoring-Fenster einen Überblick über alle relevanten CO2-bezogenen Werte.
  • Fraktionale, endtidale CO2-Konzentration: FetCO2 (%) 
  • Endtidaler CO2-Druck: PetCO2 (mmHg) 
  • Anstieg des alveolaren Plateaus in der PetCO2-Kurve, der den Volumen-/Flow-Status der Lunge anzeigt: SlopeCO2 (%CO2/l)
  • Alveolare Tidalbeatmung: VTalv (ml) 
  • Alveolares Minutenvolumen: VTalv/min (l/min) 
  • CO2-Eliminierung: V’CO2 (ml/min) 
  • Atemwegstotraum: Vds (ml)
  • Atemwegs-Totraumfraktion an der Atemwegsöffnung: Vds/VTE (%) 
  • Exspiriertes CO2-Volumen: VeCO2 (ml) 
  • Inspiriertes CO2-Volumen: ViCO2 (ml)
Volumetrischen Kapnographie (eBook)

Kostenloses eBook

Gut zu wissen! Alles über die volumetrische Kapnographie

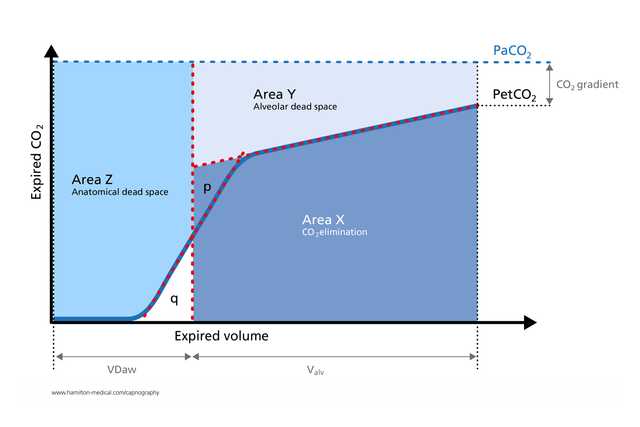
Das eBook erklärt, wie ein volumetrisches Kapnogramm interpretiert wird, und stellt einen Überblick über die Vorteile und klinische Anwendung der volumetrischen Kapnographie zur Verfügung. Selbsttest inkludiert!
Statistische Grafik: www.hamilton-medical.com/capnography

Was spricht dafür? Klinische Nachweise im Überblick

  • Das volumetrische Kapnogramm wurde erfolgreich für die Messung des anatomischen Totraums, der pulmonalen Kapillardurchblutung und der Beatmungseffizienz eingesetzt (Romero PV, Lucangelo U, Lopez Aguilar J, Fernandez R, Blanch L. Physiologically based indices of volumetric capnography in patients receiving mechanical ventilation. Eur Respir J. 1997;10(6):1309-1315. doi:10.1183/09031936.97.100613092​).

  • Die aus der volumetrischen Kapnographie abgeleiteten Berechnungen sind nützlich, um eine Lungenembolie am Patientenbett zu erkennen (Blanch L, Romero PV, Lucangelo U. Volumetric capnography in the mechanically ventilated patient. Minerva Anestesiol. 2006;72(6):577-585. 3​).

  • In einer Studie an maschinell beatmeten ARDS-Patienten waren volumetrische Kapnographie-Messungen des Verhältnisses von physiologischem Totraum zu Tidalvolumen ebenso genau wie die Werte, die mit der Überwachung der metabolischen Rate ermittelt wurden (Kallet RH, Daniel BM, Garcia O, Matthay MA. Accuracy of physiologic dead space measurements in patients with acute respiratory distress syndrome using volumetric capnography: comparison with the metabolic monitor method. Respir Care. 2005;50(4):462-467. 4​).

  • Das exspiratorische Kapnogramm ist eine anstrengungsunabhängige, schnelle und nichtinvasive Messung, die bei erwachsenen Asthmapatienten die Erkennung signifikanter Bronchospasmen unterstützen kann (Yaron M, Padyk P, Hutsinpiller M, Cairns CB. Utility of the expiratory capnogram in the assessment of bronchospasm. Ann Emerg Med. 1996;28(4):403-407. doi:10.1016/s0196-0644(96)70005-75​).

  • Die volumetrische Kapnographie bietet auf nichtinvasive Weise in Echtzeit wertvolle Einblicke in die Physiologie des Lungenkollapses und des Recruitments und eignet sich daher zur Überwachung zyklischer Recruitmentmanöver am Patientenbett (Tusman G, Suarez-Sipmann F, Böhm SH, et al. Monitoring dead space during recruitment and PEEP titration in an experimental model. Intensive Care Med. 2006;32(11):1863-1871. doi:10.1007/s00134-006-0371-76​).

Grafische Darstellung: Studentin hält ihr Diplom in der Hand

Gut zu wissen! Schulungsressourcen für die volumetrische Kapnographie

Zubehör und Verbrauchsmaterialien

Wir bieten Originalverbrauchsmaterialien für Erwachsene, Pädiatrie und Neonaten. Je nach den Richtlinien in Ihrer Einrichtung haben Sie die Wahl zwischen wiederverwendbaren Produkten und Ausführungen für den Einmalgebrauch.

Verfügbarkeit

Die volumetrische Kapnographie ist auf den Beatmungsgeräten HAMILTON-C6, HAMILTON-G5, HAMILTON-C3, HAMILTON-C1/T1 als Option verfügbar und gehört auf dem HAMILTON-S1 zu den Standardfunktionen.

Using the features of the time and volumetric capnogram for classification and prediction.

Jaffe MB. Using the features of the time and volumetric capnogram for classification and prediction. J Clin Monit Comput. 2017;31(1):19-41. doi:10.1007/s10877-016-9830-z

Quantitative features derived from the time-based and volumetric capnogram such as respiratory rate, end-tidal PCO2, dead space, carbon dioxide production, and qualitative features such as the shape of capnogram are clinical metrics recognized as important for assessing respiratory function. Researchers are increasingly exploring these and other known physiologically relevant quantitative features, as well as new features derived from the time and volumetric capnogram or transformations of these waveforms, for: (a) real-time waveform classification/anomaly detection, (b) classification of a candidate capnogram into one of several disease classes, (c) estimation of the value of an inaccessible or invasively determined physiologic parameter, (d) prediction of the presence or absence of disease condition, (e) guiding the administration of therapy, and (f) prediction of the likely future morbidity or mortality of a patient with a presenting condition. The work to date with respect to these applications will be reviewed, the underlying algorithms and performance highlighted, and opportunities for the future noted.

Physiologically based indices of volumetric capnography in patients receiving mechanical ventilation.

Romero PV, Lucangelo U, Lopez Aguilar J, Fernandez R, Blanch L. Physiologically based indices of volumetric capnography in patients receiving mechanical ventilation. Eur Respir J. 1997;10(6):1309-1315. doi:10.1183/09031936.97.10061309

Several indices of ventilatory heterogeneity can be identified from the expiratory CO2 partial pressure or CO2 elimination versus volume curves. The aims of this study were: 1) to analyse several computerizable indices of volumetric capnography in order to detect ventilatory disturbances; and 2) to establish the relationship between those indices and respiratory system mechanics in subjects with normal lungs and in patients with acute respiratory distress syndrome (ARDS), both receiving mechanical ventilation. We studied six normal subjects and five patients with early ARDS mechanically ventilated at three levels of tidal volume (VT). Respiratory system mechanics were assessed by end-expiratory and end-inspiratory occlusion methods, respectively. We determined Phase III slopes, Fletcher's efficiency index, Bohr's dead space (VD,Bohr/VT), and the ratio of alveolar ejection volume to tidal volume (VAE/VT) from expiratory capnograms, as a function of expired volume. Differences between normal subjects and ARDS patients were significant both for capnographic and mechanical parameters. Changes in VT significantly altered capnographic indices in normal subjects, but failed to change ventilatory mechanics and VAE/VT in ARDS patients. After adjusting for breathing pattern, VAE/VT exhibited the best correlation with the mechanical parameters. In conclusion, volumetric capnography, and, specifically, the ratio of alveolar ejection volume to tidal volume allows evaluation and monitoring of ventilatory disturbances in patients with adult respiratory distress syndrome.

Volumetric capnography in the mechanically ventilated patient.

Blanch L, Romero PV, Lucangelo U. Volumetric capnography in the mechanically ventilated patient. Minerva Anestesiol. 2006;72(6):577-585.

Expiratory capnogram provides qualitative information on the waveform patterns associated with mechanical ventilation and quantitative estimation of expired CO2. Volumetric capnography simultaneously measures expired CO2 and tidal volume and allows identification of CO2 from 3 sequential lung compartments: apparatus and anatomic dead space, from progressive emptying of alveoli and alveolar gas. Lung heterogeneity creates regional differences in CO2 concentration and sequential emptying contributes to the rise of the alveolar plateau and to the steeper the expired CO2 slope. The concept of dead space accounts for those lung areas that are ventilated but not perfused. In patients with sudden pulmonary vascular occlusion due to pulmonary embolism, the resultant high V/Q mismatch produces an increase in alveolar dead space. Calculations derived from volumetric capnography are useful to suspect pulmonary embolism at the bedside. Alveolar dead space is large in acute lung injury and when the effect of positive end-expiratory pressure (PEEP) is to recruit collapsed lung units resulting in an improvement of oxygenation, alveolar dead space may decrease, whereas PEEP-induced overdistension tends to increase alveolar dead space. Finally, measurement of physiologic dead space and alveolar ejection volume at admission or the trend during the first 48 hours of mechanical ventilation might provide useful information on outcome of critically ill patients with acute lung injury or acute respiratory distress syndrome.

Accuracy of physiologic dead space measurements in patients with acute respiratory distress syndrome using volumetric capnography: comparison with the metabolic monitor method.

Kallet RH, Daniel BM, Garcia O, Matthay MA. Accuracy of physiologic dead space measurements in patients with acute respiratory distress syndrome using volumetric capnography: comparison with the metabolic monitor method. Respir Care. 2005;50(4):462-467.


BACKGROUND

Volumetric capnography is an alternative method of measuring expired carbon dioxide partial pressure (P(eCO2)) and physiologic dead-space-to-tidal-volume ratio (V(D)/V(T)) during mechanical ventilation. In this method, P(eCO2) is measured at the Y-adapter of the ventilator circuit, thus eliminating the effects of compression volume contamination and the need to apply a correction factor. We investigated the accuracy of volumetric capnography in measuring V(D)/V(T), compared to both uncorrected and corrected measurements, using a metabolic monitor in patients with acute respiratory distress syndrome (ARDS).

METHODS

There were 90 measurements of V(D)/V(T) made in 23 patients with ARDS. The P(eCO2) was measured during a 5-min expired-gas collection period with a Delta-trac metabolic monitor, and was corrected for compression volume contamination using a standard formula. Simultaneous measurements of P(eCO2) and V(D)/V(T) were obtained using volumetric capnography.

RESULTS

V(D)/V(T) measured by volumetric capnography was strongly correlated with both the uncorrected (r2 = 0.93, p < 0.0001) and corrected (r2 = 0.89, p < 0.0001) measurements of V(D)/V(T) made using the metabolic monitor technique. Measurements of V(D)/V(T) made with volumetric capnography had a bias of 0.02 and a precision of 0.05 when compared to the V(D)/V(T) corrected for estimated compression volume contamination.

CONCLUSION

Volumetric capnography measurements of V(D)/V(T) in mechanically-ventilated patients with ARDS are as accurate as those obtained by metabolic monitor technique. .

Utility of the expiratory capnogram in the assessment of bronchospasm.

Yaron M, Padyk P, Hutsinpiller M, Cairns CB. Utility of the expiratory capnogram in the assessment of bronchospasm. Ann Emerg Med. 1996;28(4):403-407. doi:10.1016/s0196-0644(96)70005-7


STUDY OBJECTIVE

To determine whether the plateau phase of the expiratory capnogram (dco2/dt) can detect bronchospasm in adult asthma patients in the emergency department and to assess the correlation between dco2/dt and the peak expiratory flow rate (PEFR) in spontaneously breathing patients with asthma and in normal, healthy volunteers.

METHODS

We carried out a prospective, blinded study in a university hospital ED. Twenty adults (12 women) with acute asthma and 28 normal adult volunteers (15 women) breathed through the sampling probe of an end-tidal CO2 monitor, and the expired CO2 waveform was recorded. The dco2/dt of the plateau (alveolar) phase for five consecutive regular expirations was measured and a mean value calculated for each patient. The best of three PEFRs was determined. The PEFR and dco2/dt were also recorded after treatment of the asthmatic patients with inhaled beta-agonists.

RESULTS

The mean +/- SD PEFR of the asthmatic subjects was 274 +/- 96 L/minute (57% of the predicted value), whereas that of the normal volunteers was 527 +/- 96 L/minute (103% of the predicted value) (P < .001). The mean dco2/dt of the asthmatic subjects (.26 +/- .06) was significantly steeper than that of the normal volunteers (.13 +/- .06) (P < .001). The dco2/dt was correlated with PEFR (r = .84, P < .001). In 18 asthmatic subjects the pretreatment and posttreatment percent predicted PEFRS were 58% +/- 17% and 74% +/- 17%, respectively (P < .001), whereas the dco2/dt values were .27 +/- .05 and .19 +/- .07, respectively (P < .005).

CONCLUSION

The dco2/dt is an effort-independent, rapid noninvasive measure that indicates significant bronchospasm in ED adult patients with asthma. The dco2/dt value is correlated with PEFR, an effort-dependent measure of airway obstruction. The change in dco2/dt with inhaled beta-agonists may be useful in monitoring the therapy of acute asthma.

Monitoring dead space during recruitment and PEEP titration in an experimental model.

Tusman G, Suarez-Sipmann F, Böhm SH, et al. Monitoring dead space during recruitment and PEEP titration in an experimental model. Intensive Care Med. 2006;32(11):1863-1871. doi:10.1007/s00134-006-0371-7


OBJECTIVE

To test the usefulness of dead space for determining open-lung PEEP, the lowest PEEP that prevents lung collapse after a lung recruitment maneuver.

DESIGN

Prospective animal study.

SETTING

Department of Clinical Physiology, University of Uppsala, Sweden.

SUBJECTS

Eight lung-lavaged pigs.

INTERVENTIONS

Animals were ventilated using constant flow mode with VT of 6ml/kg, respiratory rate of 30bpm, inspiratory-to-expiratory ratio of 1:2, and FiO(2) of 1. Baseline measurements were performed at 6cmH(2)O of PEEP. PEEP was increased in steps of 6cmH(2)O from 6 to 24cmH(2)O. Recruitment maneuver was achieved within 2min at pressure levels of 60/30cmH(2)O for Peak/PEEP. PEEP was decreased from 24 to 6cmH(2)O in steps of 2cmH(2)O and then to 0cmH(2)O. Each PEEP step was maintained for 10min.

MEASUREMENTS AND RESULTS

Alveolar dead space (VD(alv)), the ratio of alveolar dead space to alveolar tidal volume (VD(alv)/VT(alv)), and the arterial to end-tidal PCO(2) difference (Pa-ET: CO(2)) showed a good correlation with PaO(2), normally aerated areas, and non-aerated CT areas in all animals (minimum-maximum r(2)=0.83-0.99; p<0.01). Lung collapse (non-aerated tissue>5%) started at 12[Symbol: see text]cmH(2)O PEEP; hence, open-lung PEEP was established at 14cmH(2)O. The receiver operating characteristics curve demonstrated a high specificity and sensitivity of VD(alv) (0.89 and 0.90), VD(alv)/VT(alv) (0.82 and 1.00), and Pa-ET: CO(2) (0.93 and 0.95) for detecting lung collapse.

CONCLUSIONS

Monitoring of dead space was useful for detecting lung collapse and for establishing open-lung PEEP after a recruitment maneuver.